
Does your business make or lose money? Tracking your small business's financial progress through a profit and loss (P&L) statement may be the answer to determine how your business is doing financially.
A profit and loss statement allows you to determine if your company is profitable and growing or if, on the other hand, it is losing money and you need to take some action. In this guide, we will first define the main components of a profit and loss statement, how to create your P&L step by step, and how you can use your report to assess your company's financial health.
So don't wait any longer; get complete control of your business finances!
What is a P&L?
A profit and loss statement, also known as an income statement or P&L, tracks the amount of profit after a business subtracts all of its costs from its revenue during a specific accounting period, typically monthly, quarterly, and annually.
A P&L statement enables you to identify areas where your business is performing well or struggling, allowing you to make informed decisions for improvement. A P&L statement can also be used as a baseline to produce a model for the future performance of your business.
The Main Components of a Profit and Loss Statement
To fully understand and interpret a P&L statement, it's crucial to grasp its key components. Below, we describe seven critical elements of a basic P&L, which, at its core, paint a comprehensive picture of your business's financial performance.
1. Revenue
Revenue is a company's total income through business activities within a specific period. It represents the money received from selling goods, providing services, or other sources related to the company's primary operations.
To determine the revenue of your business, multiply the price of the product or service by the number of units sold.
Let's assume that your company manufactures and sells wooden chairs, and you sell 100 wooden chair units in a year for $50 each unit. The revenue from this product for that year would be:
100 units * $50/unit = $5,000
This $5,000 is your company's revenue from this product for that year. Note that it doesn't account for any costs or expenses the company incurred to produce or sell the product—those you would have to subtract later to determine net income or profit.
2. Cost of Goods Sold
Cost of Goods Sold (COGS) is the direct cost of producing goods a company sells. COGS includes direct labor costs involved in creating the goods and the cost of materials used. To calculate COGS, you can use the following formula:
COGS = Opening inventory + Purchases during the period - closing inventory
Let's break down each term:
Opening inventory: This is the value of the goods available for sale at the start of the accounting period.
Purchases during the period: This is the cost of additional Inventory bought during the accounting period.
Closing inventory: This is the value of the goods still available for sale at the end of the accounting period.
For example, if a company starts with $1,000 worth of inventory, purchases an additional $2,000 worth during the year, and ends the year with $500 worth of stock, the COGS for that year would be:
COGS = $1,000 (Opening inventory) + $2,000 (Purchases) - $500 (Closing inventory) = $2,500

3. Gross Profit
Gross profit, which you can calculate by subtracting the cost of goods sold (COGS) from total revenue, gives you a snapshot of your company's financial health. Think of it as a measure of how efficiently your company turns resources like labor and materials into revenue.
Here's the formula you'll use:
Operating income = Gross profit - Operating expenses
The importance of gross profit can't be overstated. It serves as a critical indicator of your company's financial performance. Companies that maintain high gross profit margins tend to be more stable as they retain more funds to cover operating expenses, deal with unexpected costs, or reinvest for growth.
4. Operating Expenses
Operating expenses refer to the costs incurred while carrying out its day-to-day operations. These expenses may include but are not limited to the following:
Rent
Utility bills for office space
Salaries and wages of employees
Marketing and advertising costs
Office supplies and equipment
Maintenance and repair expenses
Depreciation and amortization costs
Insurance of employees
Professional services such as legal and accounting fees and taxes are associated with the business's daily operations.
To calculate the operating expenses for a particular period, you need to add up all the non-production costs that the business incurred during that period. It is important to note that operating expenses are distinct from capital expenses, which are costs incurred by the business to acquire or improve long-term assets such as buildings, equipment, or vehicles.
5. Operating Income
Operating income measures the profit a company generates from its core operations before interest and taxes. It excludes non-operating income, such as investment or interest expenses. To calculate your business operating income, you can use the following formula:
Operating Income = Gross Profit - Operating Expenses
Here is an example of how to calculate operating income:
A company has a revenue of $100,000.
The COGS for the company is $50,000.
The operational expenses for the company are $30,000.
Therefore, the operating income for the company is:
Operating income = $100,000 - $50,000 - $30,000 = $20,000
The operating income provides insight into the operational efficiency of the company. The higher the operating income, the more profitable the company's core business operations are. If the operating income is low or negative, it may indicate that the company is not managing its operating costs efficiently.
6. Non-Operating Income & Expenses
Non-operating income and expenses are the income and expenses that are not directly related to the company's core business operations. They are reported separately from operating income and expenses.
Some examples of non-operating income include:
Interest income from investments
Dividend income from stocks or other securities
Gains from the sale of assets
Rental income from property
Some examples of non-operating expenses include:
Interest expense on debt
Losses from the sale of assets
Write-downs of assets
Fines and penalties
Non-operating income and expenses can be calculated by adding up all of the income and expenses that are not directly related to the company's core business operations.
Here is an example of how to calculate non-operating income and expenses:
A company has an interest income of $7,500, a dividend income of $5,000, and gains from selling assets of $20,000.
The company also has interest expense of $5,000, losses from the sale of assets of $7,500, write-downs of assets of $2,000, and fines and penalties of $1,000.
Therefore, the non-operating income for the company is $7,500 + $5,000 + $20,000 = $35,000.
And the non-operating expenses for the company are $5,000 + $7,500 + $2,000 + $1,000 = $18,000.
The net non-operating income for the company is $35,000 - $18,000 = $17,000.
7. Net Profit
Net profit, also known as net income or net earnings, is the amount of revenue left over after all expenses, taxes, and additional income and costs have been accounted for. It is a crucial measure of a company's profitability.
The formula for net profit is:
Net profit = Total Revenue - Total Expenses
Total revenue includes all income from a company's primary operations. In contrast, total expenses include all costs, such as the cost of goods sold (COGS), operating expenses, interest, taxes, and other expenses.
For example, if your total revenue for a period is $100,000 and your total expenses are $80,000, then your net profit would be:
$100,000 (Total Revenue) - $80,000 (Total Expenses) = $20,000 (Net Profit)
This calculation tells you how much profit your company has made after accounting for all revenues and expenses and thus reflects the final bottom line of your company for the given period.
Steps to Create a P&L Statement
After you gather all the relevant information mentioned above, to create a basic P&L manually for your small business, take the following steps:
Determine the revenue - this is the total money earned by the company during a specific period.
Determine the cost of goods sold (COGS) - the cost of the products or services the company has sold during the same period.
Calculate the gross profit - the difference between the revenue and the COGS.
Determine the operating expenses that the company incurs to operate its business, such as rent, salaries, and utilities.
Calculate the operating income - the difference between the gross profit and the operating expenses.
Determine the non-operating income and expenses - these are income and expenses that are not directly related to the company's operations, such as interest income and interest expense.
Calculate the net income - the difference between operating and non-operating income and expenses.
After completing Step 7, you have your very own P&L. Below, you can appreciate a picture of what a simple profit and loss statement template looks like:
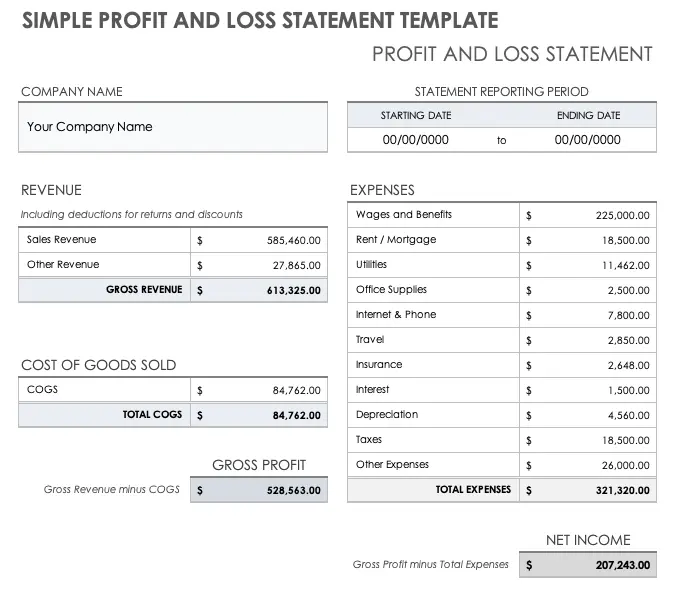
The image above presents a snapshot of a Profit and Loss Statement, displaying key financial information that unveils the company's overall financial performance over a specific period.
Remember that these steps will give you a simplified P&L statement. More complex businesses may need to account for more factors, such as depreciation, amortization, and changes in inventory, among others.
By comparing this P&L statement with previous years, the business owners can track performance, identify trends, and make informed decisions to continue growing their business.
Now that you're familiar with the critical components of a P&L, the next step is to get to work and create your own. For this, we recommend that you contact a financial specialist, or you can also make your P&L statement using a profit and loss statement template.
Analyzing your metrics can help you optimize your business operations and invest in your long-term success. We hope this article has been helpful for you to start preparing a profit and loss statement for your business.
Disclaimer: The content of this post has been prepared for informational purposes only. It is not intended to provide and should not be relied on for tax, legal, or accounting advice. Consult with your tax, legal, and accounting advisor before engaging in any transaction.

José Miguel Vera
SVP of Growth & Marketing
One Park Financial's editorial team brings together funding specialists, business strategists, and small business advocates to create practical content for the entrepreneurs we serve.
.jpg)
.jpg)
.jpg)